Friday, April 19, 2024

fentanyl

Смертность от передозировок наркотиками в США растёт пугающими темпами


В 2022 в США зафиксировано больше 110 тысяч смертей от передозировки наркотиками, из них 76 тысяч - от передозировки синтетическими опиоидами. Для сравнения, в 2010 смертей было 40 тысяч, а на синтетические опиоиды приходилась буквально пара процентов от общего числа

Что произошло? Во-первых, кризис, вызванный наркотическими обезболивающими. Во-вторых - фентанил, синтетический опиоид в 50 раз сильнее героина. Специальный правительственный комитет в США во вторник опубликовал отчёт, из которого следует, что значимая часть фентанила в США приходит из Китая, а его производство и доставка в США активно спонсируются китайским правительством.

Wednesday, April 17, 2024

premium poetry

Dementev

Российская поэтическая премия запретила номинироваться поэтам-трансгендерам


Организаторы поэтической премии Андрея Дементьева внесли условие, по которому на конкурс «не допускаются граждане, сменившие пол», с мотивировкой «в целях сохранения традиционных для российского общества <…> представлений о браке, семье, материнстве, отцовстве, детстве».

Это указано в перечне необходимых материалов на сайте премии.

От участников требуют прилагать копию свидетельства о рождении, а также давать ответ на соответствующий вопрос в анкете и заверять ее подписью.

При этом россияне, совершившие трансгендерный переход, обычно могут получить новые свидетельства о рождении.

Доподлинно установить факт перехода только по ним невозможно.

Награды лауреатам предусмотрены в двух категориях, в одной обещают премию в 300 тысяч рублей, в другой — 700 тысяч рублей.

Премия названа в честь советского литератора и поэта-песенника Андрея Дементьева. Среди прочего он был замглавреда и потом главным редактором литературно-художественного журнала «Юность» в 1972–1993 годы.

Стихотворение Дементьева декламировал Владимир Путин 8 марта 2018 года в качестве поздравления.

На сайте премии также сообщается, что в годы руководства «Юностью» Дементьев вступил в отношения с девушкой по имени Анна Пугач, почти на тридцать лет его младше и только что выпустившейся из школы — она пришла работать в журнал в отдел писем. Позже Пугач вышла за него замуж и сама стала известной журналисткой. Они были в браке до смерти Дементьева в 2018 году.

Tuesday, April 16, 2024

LEX during covid pandemic


COVID-19 exacerbated inequalities in life expectancy in Den mark


Social inequalities in mortality expanded during the COVID-19 pandemic in Denmark. Cosmo Strozza, Serena Vigezzi, Julia Callaway, and José Manuel Aburto quantified life expectancy changes in 2020 and 2021 and underlying causes of death. COVID-19, as well as other causes, contributed to these changes.


The COVID-19 pandemic disrupted life expectancy trends in most high-income countries. In Denmark, while overall life expectancy returned to 2019 levels after the initial two pandemic years (2020 and 2021), this pattern was not observed across all the socioeconomic strata of the Danish population. Indeed, contrary to what many people outside the Nordic countries believe, large social inequalities in life expectancy persist in the Nordic countries (Brønnum-Hansen et al. 2021). In a recent publication (Strozza et al. 2024), using Danish registry data from 2014 to 2021 for all individuals aged 30 years and over, we investigated whether the COVID-19 pandemic magnified social inequalities in life expectancy in Denmark, and examined what causes of death contributed most to the observed changes.
 

Life expectancy changes during the COVID-19 pandemic


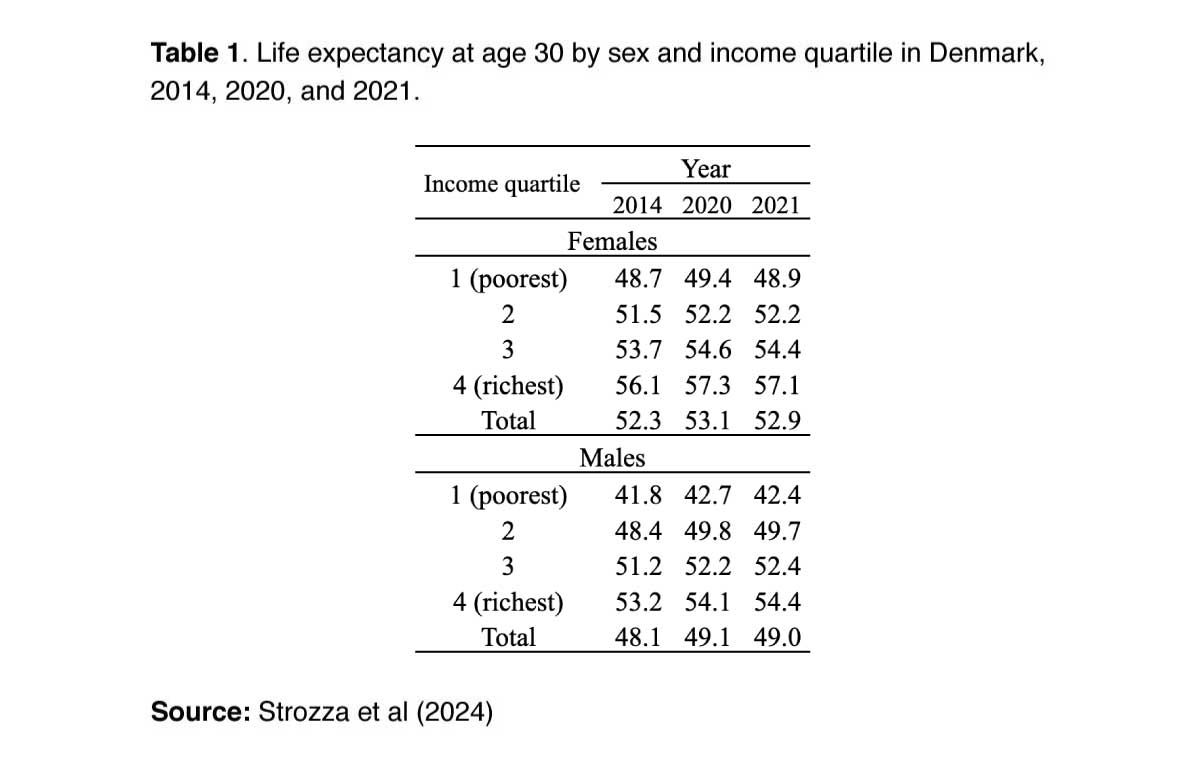
Life expectancy can be calculated in different years and at various ages. Table 1, for instance, shows life expectancy at 30 years at the beginning of the period and for the first two pandemic years by sex and income quartile, used as a proxy of socioeconomic status (SES).

Life expectancy is a snapshot of mortality conditions, and not a forecast of any individual’s lifespan. Therefore, its decline does not represent the number of years that will be deducted from the lifespans of individuals; rather, it provides a comparable measure of the impact of the mortality shock generated by the pandemic.

Table 1 shows yearly changes in life expectancy by sex and income quartile for the five years prior to the pandemic (2014-2019) and the initial two pandemic years (2020-2021).

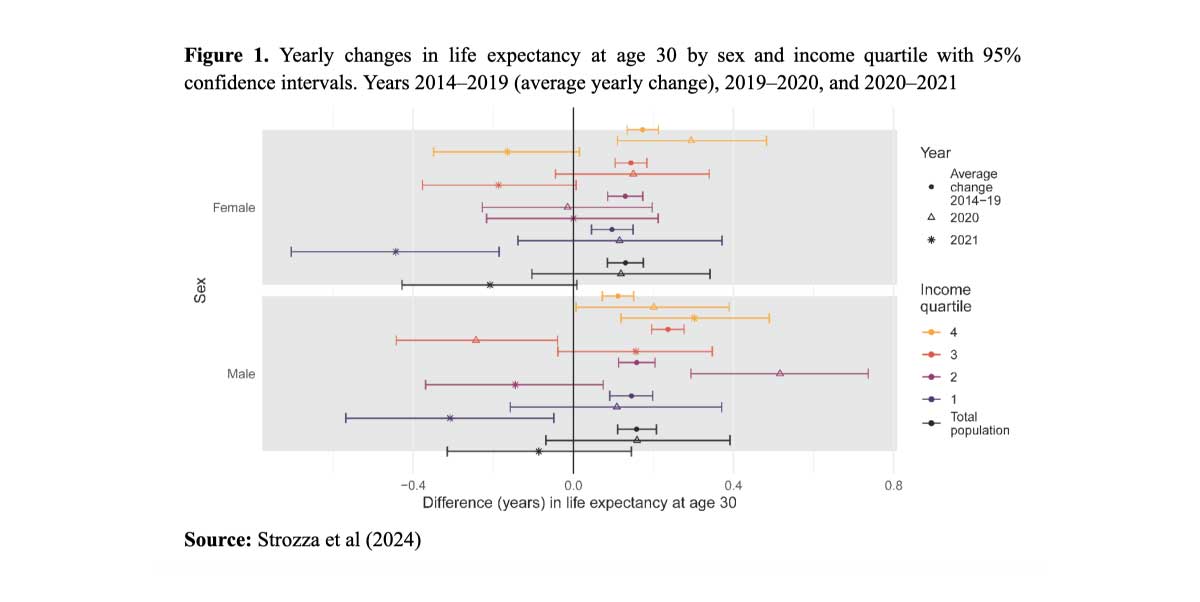
Before the pandemic, yearly female life expectancy gains followed a social gradient. In other words, life expectancy was increasing faster for women in the highest socioeconomic groups than in the lowest. However, the confidence intervals shown in Figure 1 suggest that these results should be interpreted with caution. This was the case, to some extent, for men too, with the exception of the highest income group, where survival improvements were relatively limited. However, the differences in life expectancy changes were small, and the gap in life expectancy between the highest and lowest income groups remained large.

Figure 1 illustrates the Danish COVID-19 success story of 2020, when small gains in life expectancy were observed in the overall population (Aburto et al. 2021), as well as for most sub-populations, possibly due to the timing of policy interventions. However, the situation changed in 2021, and life expectancy losses were observed for the overall population (Schöley et al. 2022) and for most sub-populations.
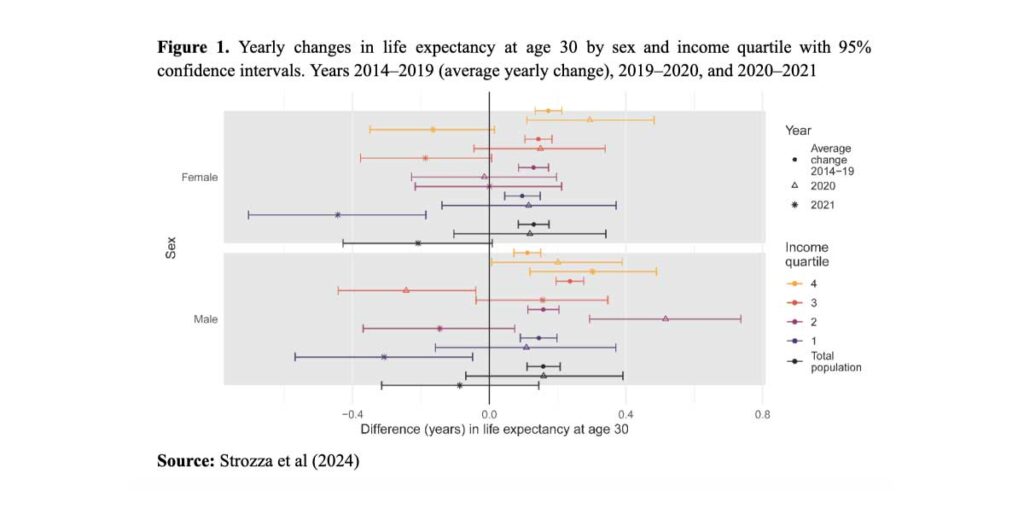
Focusing on 2021, we observe a social gradient in life expectancy changes for both men and women. Among women, all sub-populations experienced a loss in life expectancy, with those in the highest income group experiencing the smallest loss, less than two and a half months, compared to those in the lowest income group, who lost almost six months. Among men, those in the highest income groups experienced gains in life expectancy, while those in the lowest income groups experienced losses, the extent of which spanned from of almost four months gained to almost four months lost between 2020 and 2021. To summarize, inequalities in life expectancy increased across socioeconomic groups for both women and men. While the confidence intervals for the 2020 results mostly overlap, in 2021 this is the case for women but not for men, at least not when the top and the bottom quartiles are compared.

Causes of death contributing to changes in life expectancy


COVID-19 was not the only factor that contributed to changes in life expectancy over this period. Mortality from other leading causes of death changed too, illustrating socioeconomic inequalities in health caused indirectly by the pandemic.

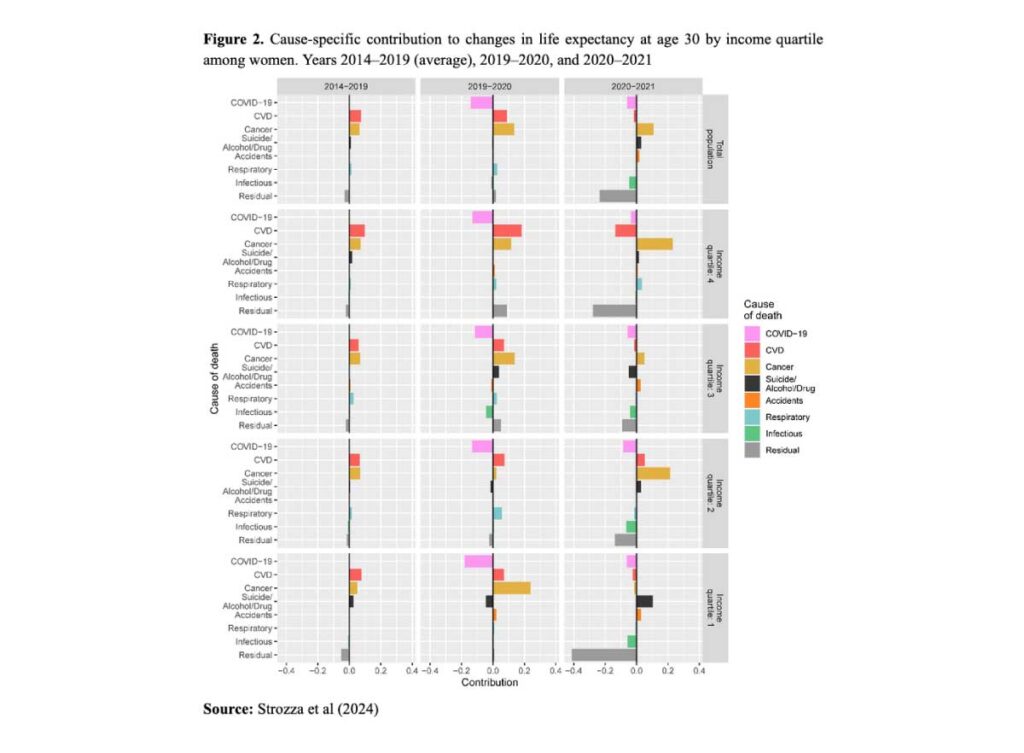
Figures 2 and 3 show cause-specific contributions to changes in life expectancy at age 30 by income quartile for women and men, respectively. Note that individual year-on-year changes include random variability, and thus require caution in their interpretation. The positive trend in 2020 was due to a decrease in cardiovascular disease and cancer mortality across income quartiles, which counterbalanced the negative contributions of COVID-19. The smaller losses among women in the highest income group in 2021 were explained by decreases in cancer mortality and a smaller negative contribution of COVID-19 and residual causes. For those in the lowest income group, cancer mortality increased slightly, contributing to small negative changes in life expectancy. Slightly higher COVID-19 mortality, together with a high contribution from residual causes and infectious diseases accounted for the rest. Analyzing changes in other causes of death, in conjunction with COVID-19 deaths, gives a more complete picture of the indirect impacts of the pandemic.
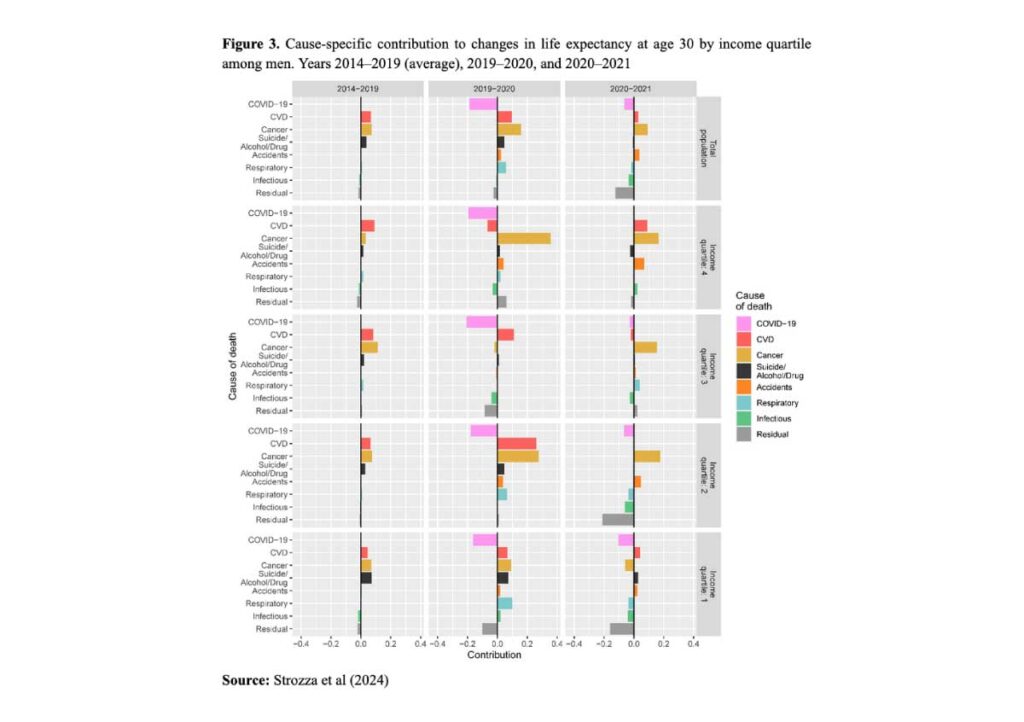
Among men, reductions in cardiovascular disease and cancer mortality also counteracted the emergence of COVID-19 in 2020, as they did for women, although other causes, such as accidents, deaths caused by suicide, drugs, or alcohol abuse, and deaths due to respiratory diseases had negative effects on changes in life expectancy in the lowest income groups. In 2021, cardiovascular disease and cancer mortality continued to decrease in high-income groups, leading to positive contributions to changes in life expectancy, while COVID-19 had practically no impact. Low-income groups, on the other hand, experienced increased mortality from COVID-19 as well as from respiratory diseases, infectious diseases, and other residual causes. For both women and men, this shows how the direct and indirect effects of COVID-19 contributed to the increasing life expectancy gap across socioeconomic groups.
 

Conclusions


Disparities in life expectancy across income groups in Denmark increased after the initial two pandemic years. The well-established mortality gaps were exacerbated by the dual impact of the pandemic, both directly through COVID-19 mortality, and indirectly through greater social inequalities in mortality from other causes of death. Our findings emphasize the critical need for more focused interventions for socially disadvantaged sub-groups during health emergencies. These interventions should not be restricted to the cause of the crisis itself, but are key to preventing a further widening of the gap between the most and least vulnerable sub-groups. Ultimately, this approach will foster a more equitable response to health crises.

References

  • Aburto JM, Schöley J, Kashnitsky I, Zhang L, Rahal C, Missov TI, et al. Quantifying impacts of the COVID-19 pandemic through life-expectancy losses: a population-level study of 29 countries. Int J Epidemiol. 2021;51(1):63-74. https://doi.org/10.1093/ije/dyab207
  • Brønnum-Hansen H, Östergren O, Tarkiainen L, Hermansen Å, Martikainen P, van der Wel KA, et al. Changes in life expectancy and lifespan variability by income quartiles in four Nordic countries: a study based on nationwide register data. BMJ Open. 2021;11(6): e048192. doi.org/10.1136/jech-2020-214108
  • Schöley J, Aburto JM, Kashnitsky I, Kniffka MS, Zhang L, Jaadla H, et al. Life expectancy changes since COVID-19. Nat Hum Behav. 2022;6(12):1649–59. doi.org/10.1038/s41562-022-01450-3
  • Strozza, C., Vigezzi, S., Callaway, J., and Aburto J.M. (2024). The impact of COVID-19 on life expectancy across socioeconomic groups in Denmark. Population Health Metrics 22, 3. doi.org/10.1186/s12963-024-00323-3

danger

Новый закон о смене пола в Германии ущемляет права женщин

 — журналистка BILD


В пятницу Бундестаг принял Закон о самоопределении. Теперь менять пол в ФРГ можно раз в год с помощью простого устного заявления. Глава новостной службы BILD Майке Клебль назвала это «чёрным днём» для прав женщин и напомнила, что в Бундестаге уже заседают два депутата-трансгендера. Это Тесса Гансерер и Нике Славик (на фото), прошедшие в парламент по женскому списку «Зелёных». Публикуем полный текст Клебль:

«Десятилетия борьбы за права женщин, безопасные зоны и равные права сметены одним взмахом. Это окончательная победа мужчин над женщинами. Это может показаться радикальным. Но именно это и происходит, когда мужчины решают, что означает быть женщиной, и могут заявлять о себе как о женщинах посредством устного заявления, присваивая себе их права и безопасные зоны. Квоты для женщин сейчас де-факто отменены. Даже если они и противоречивы, сама демократическая дискуссия о привилегиях [женщин] теперь невозможна по закону. Хуже того: женщин принуждают делиться своими безопасными зонами, такими как раздевалки, с теми, кто объявил себя женщиной, не отказавшись от бороды и пениса. Женщин заставляют воспринимать мужчин в их раздевалке, как женщин. Это не что иное, как принуждение.

Сторонники [закона] поспешили назвать это «единичным случаем». Но уже есть множество сообщений из нашей страны и из-за границы о мужчинах в женской одежде, которые нападали на женщин в женских раздевалках. Мне неизвестно, чтобы женщина в мужской одежде напала на мужчин ради секса в мужской раздевалке. Никто не против улучшения условий жизни настоящих трансгендеров, которых на самом деле очень мало. Но не за счёт всех женщин и девочек. Этот закон не делает мир лучше. Просто женщинам стало ещё опаснее, чем было раньше»

Monday, April 15, 2024

Sociology beyond Societies

In this ground-breaking contribution to social theory, John Urry argues that the traditional basis of sociology – the study of society – is outmoded in an increasingly borderless world. If sociology is to make a pertinent contribution to the undersanding of the ‘post-societal’ era it must forget the social rigidities of the pre-global order and, instead, switch its focus to the study of physical, imaginative and virtual movements. In considering this ‘sociology of mobilities’, the book concerns itself with the travels of people, ideas, images, objects, messages, waste products and money across international borders, and the implications these mobilities have for the experiences of time, space, dwelling and citizenship.

Sociology beyond Societies extends recent debate about globalisation, both by providing an analysis of how mobilities reconstitute social life in uneven and complex ways, and by arguing for the significance of objects, senses, time and space in the theorising of global processes. 

John Urry is Professor of Sociology at Lancaster University.

Sunday, April 14, 2024

record low proportion

Рекордно низкая доля россиян хотела бы переехать за границу на постоянное место жительства


Только 9% опрошенных в марте 2024 жителей нашей страны сказали, что хотели бы уехать жить за границу. Это самый низкий показатель за всю историю наблюдений: годом ранее было 11%, а весной 2021 были зафиксированы рекордные 22%

Ожидаемо, чаще всего хотят уехать жить в другую страну молодые (15% в когорте 18-24), реже всего - представители старшей возрастной группы (3% в когорте 55+)

the reasons

Причины для отъезда из страны по мнению россиян


Главная мотивация для желания уехать из России - это желание обеспечить своим детям достойное будущее. Эту причину назвали 43% из тех участников опроса, которые хотели бы переехать жить за границу.

Второе место разделили политическая и экономическая обстановка в стране, следом идут интерес к другой культуре, качество медицинских услуг и большая правовая и социальная защищённость. Опасения мобилизации оказались наименее популярной причиной: всего 16% голосов

Эмиграция ради детей - единственная потенциальная причина для отъезда, популярность которой остаётся стабильно высокой уже больше десяти лет. Политическая обстановка в России как причина для отъезда становится с годами всё более популярной, а экономическая обстановка - всё менее.

where should a peasant go

Куда хотели бы уехать россияне


Самый популярный ответ на вопрос "в какую страну вы хотели бы переехать" среди желающих эмигрировать россиян - это "затрудняюсь ответить", 14% голосов.

Среди определившихся лидируют США (11%), Германия (8%), Италия и Турция (по 6%)

Friday, April 12, 2024

tea

Среднее потребление чая в странах Азии


Довольно неожиданная, как нам кажется, карта. В обыденном восприятии кажется, что больше всего чая пьют где-то на родине чая: в Китае, Японии, Индии или как-то так. Но нет!

Больше всего чая в странах Азии пьют в Турции: больше 3 кг в год на человека! Чуть меньше 2 кг на человека в год потребляет Иран, а на третьем месте мы: средний россиянин за год потребляет 1.38 кг чая! (речь, понятное дело, о заварке, а не о напитке)

А вот в Японии потребление чуть меньше килограмма на человека в год, в Китае оно не дотягивает и до полкило, в Индии - всего 330 грамм!

Global household trends:

converging sizes, divergent structures

April 8, 2024 Maria Pohl and Albert Esteve

Household structures reflect and affect social, economic, and demographic dynamics. Albert Esteve and Maria Pohl use the new CORESIDENCE database to explore the transformation of households over the last five decades. Their findings suggest a global decline in average household size, although household structures continue to differ across countries.


Households are core units of social organization and reproduction. Their fundamental characteristics, namely size and composition, reflect complex socio-economic and demographic changes (Bongaarts, 2001; Therborn, 2004, 2014). For instance, increases in one-person and two-person households at the expense of larger households might be driven by demographic changes, such as fertility decline or increased longevity. Household characteristics can have far-reaching implications for housing markets, intra and inter-household transfers, or gender relations. Studying household size or composition comparatively and over time allows us to understand how societies change, not only from a demographic standpoint but also from social and economic perspectives.

Comparative research on households on a global scale has remained relatively scarce due to data constraints. The newly developed open-access, open-source CORESIDENCE database aids researchers in filling this gap by providing harmonized household data on the national and subnational scales for 156 countries and 1,511 regions (Galeano et al., 2024), making it possible to study families and households on an international scale. Family researchers, like those studying fertility and mortality, can address questions about family change based on the increasing availability of empirical data, thanks to census microdata available from the Integrated Public Use of Microdata Series (IPUMS) and survey data from Demographic Health Surveys (DHS), Multiple Indicator Cluster Surveys (MICS), or the European Labor Force Surveys (EU-LFS).
 

Converging sizes: moving towards smaller households


Despite some definitional differences, households are considered to be suitable units for comparative research (Bongaarts, 2001). Household size refers to the number of people who are living together in a dwelling at the time of data collection. It differs substantially across countries as it reflects their diverse fertility levels (Figure 1). However, it is also determined by social norms and customs governing family-formation processes, such as norms for establishing a new, separate household upon marriage.
Households are, on average, smallest in some East Asian countries and in Europe. Denmark leads this group, with an average household size of 1.8 people. The largest households, on average, can be found in Sub-Saharan Africa and among countries of the Arabian Peninsula and Central Asia, reaching a maximum of 8.4 people per household in Senegal, for example. The vast majority of the world’s population (around 83 percent) lives in countries with an average household size of between 2.3 and 5 persons.

Household size has declined quite steadily over the past five decades, by approximately 0.5 people per decade. When average household size in a country falls to around two, the rate of decline slows down: countries with comparatively large households and high fertility levels will likely drive any further decline in average household size. Shrinking households in contexts with relatively small households might suggest an increase in one-person households, driven by young adults who postpone their transition to adulthood or by older adults, such as women who live alone after the death of a partner. However, households do not shrink in all contexts: socio-economic conditions may foster intergenerational coresidence or alternative household configurations that could, at least partially, counteract the reduction in household size due to fertility decline. Moreover, some countries (e.g. Senegal) have maintained large households despite demographic changes.
 

Divergent structures: the roles of children and other relatives


The internal structure of a household is called household composition. This structure is based on a reference person in the household, commonly referred to as the household head or reference person in survey and census data. Household composition varies in response to demographic changes, such as a decline in fertility or changes in family and relationship forms, such as living-apart-together or intergenerational coresidence (Furstenberg, 2019). Household composition further reflects the age structure of a population: the number of children and adults available in a society for distribution across households differs according to the underlying age composition of the population.

Fertility decline is a core driver of shrinking household size. However, across many contexts, the presence of other relatives of the household head is another crucial component of household composition. If the number of children in the household declines but the presence of other relatives remains stable, their relative weight in the household may increase, with possible implications for care transfers, decision-making processes, and family dynamics.

Figure 2 highlights the decline in children in the household (upper panel) across all major world regions. While children are the central driver of global heterogeneity in household size and composition, another important group contributing to global variation in household size and composition is that of other relatives (lower panel). In many countries, the presence of other relatives in absolute numbers has remained relatively unchanged.

Conclusions


Family patterns, socio-economic and demographic transformations, and cultural systems influence the persistent heterogeneity in household composition (Cherlin, 2012). Our results support the “convergence to divergence” hypothesis, which postulates that future family changes driven by social phenomena are certain but will produce different outcomes in different contexts (Pesando & GFC Team, 2019; Therborn, 2004, 2014). Fertility declines increase the prevalence of smaller households, yet we find persistent internal complexity of households in several countries. Interactions of global trends such as declining fertility and increasing life expectancy will result in different typologies of households, depending on the context in which such changes occur. We further anticipate that a continued decline in fertility rates will lead to smaller households and changes in household composition due to fewer living relatives available for coresidence.

The timing and occurrence of life-course events, societal structures, and individual factors drive variation in household structures. Shifts in transfer patterns, housing demand, gender relations, the division of labour, and living arrangements are some of the possible implications of changes in household structures. The CORESIDENCE project investigates these issues by examining links between households, living arrangements, and related socio-demographic indicators. The project entails macro- and micro-level analyses across various contexts, data sources, and spatial levels. We also invite and encourage other researchers to use the CORESIDENCE database.

Funding: CORESIDENCE is supported by an Advanced Grant funded by the European Research Council (ERC). Grant agreement ID: 101052787.


References

  • Bongaarts, J. (2001). Household size and composition in the developing world in the 1990s. Population Studies, 55(3), 263–279. https://doi.org/10.1080/00324720127697
  • Cherlin, A. J. (2012). Goode’s World Revolution and Family Patterns : A Reconsideration at Fifty Years. Population and Development Review, 38(4), 577–607. https://doi.org/10.1111/j.1728-4457.2012.00528.x
  • Esteve, A., Galeano, J., Turu, A., García-Román, J., Becca, F., Fang, H., Pohl, M., & Trias-Prats, R. (2023). The CORESIDENCE Database: National and Subnational Data on Household and Living Arrangements Around the World, 1964-2021. Zenodo. https://doi.org/10.5281/ZENODO.8142652
  • Esteve, A., Pohl, M., Becca, F., Fang, H., Galeano, J., García-Román, J., Reher, D., Trias-Prats, R., & Turu, A. (2024). A global perspective on household size and composition, 1970–2020. Genus, 80(1), 2. https://doi.org/10.1186/s41118-024-00211-6
  • Furstenberg, F. F. (2019). Family Change in Global Perspective: How and Why Family Systems Change. Family Relations, 68(3), 326–341. https://doi.org/10.1111/fare.12361
  • Galeano, J., Esteve, A., Turu, A., García-Roman, J., Becca, F., Fang, H., Pohl, M., & Trias-Prats, R. (2024). CORESIDENCE: National and subnational data on household size and composition around the world, 1964–2021. Scientific Data, 11(1), 145. https://doi.org/10.1038/s41597-024-02964-3
  • Pesando, L. M., & GFC team. (2019). Global Family Change: Persistent Diversity with Development. Population and Development Review, 45(1), 133–168. https://doi.org/10.1111/padr.12209
  • Therborn, G. (2004). Between sex and power: family in the world, 1900 – 2000 (Reprinted). Routledge.
  • Therborn, G. (2014). Family Systems of the World: Are They Converging? In. J. Treas, J. Scott, & M. Richards (Eds.), The Wiley Blackwell Companion to the Sociology of Families (1st ed., pp. 1–19). Wiley. https://doi.org/10.1002/9781118374085.ch1

Thursday, April 11, 2024

arizona

В Аризоне решили вновь применять драконовский закон, который был введен еще до того, как она стала штатом.


Верховный суд Аризоны постановил, что старинный закон, запрещающий аборты с редкими исключениями, подлежит исполнению.

Закон был принят в 1864 году — задолго до того, как Аризона стала штатом в 1912 году, — и предусматривает наказание за аборт от двух до пяти лет лишения свободы, за исключением случаев, когда жизнь матери находится под угрозой. Для случаев изнасилования и инцеста никакого исключения не предусмотрено.

«Сегодняшнее решение вновь ввести в действие закон, принятый в те времена, когда Аризона еще не была штатом, бушевала Гражданская война, а женщины даже не могли голосовать, войдет в историю как пятно на нашем штате», — заявила губернатор штата, демократка Кэти Хоббс.

menstrual cycle

MenstrualCycle

second laguage

Второй по популярности иностранный язык в школах в странах ЕС


Сразу надо сказать, что данные за 2021 год - и популярность русского в странах Балтии (где ещё три года назад он занимал второе место после английского!), очень вероятно, снизилась...

В остальном же - в странах Восточной Европы на втором месте чаще всего стоит немецкий, у соседей Франции - французский, сами французы (а ещё британцы и многие скандинавы) на второе место ставят испанский.

condom

Россияне стали экономить на презервативах.


Их продажи достигли пятилетнего минимума. За январь – февраль было продано 3,1 млн упаковок, выяснили в DSM Group.

При этом продажи противозачаточных таблеток наоборот увеличились, отмечают эксперты.

BloomEconomy